“I’m spending $20k / mo and for that I want $200k. I want 10X return.”
That’s what we heard over the phone as he made his way through the airport.
We get it. Measuring results is central to how we evaluate progress month-to-month for our agency’s Email+ services. We want to work towards an outcome that matters, not just check off activities!
As a makeshift number, we look to revenue attribution using software like Klaviyo, informed by its integration with your ecommerce platform.
The flaws with ROAS model
But what that formulation measures, revenue / spend, is not a return metric. It’s the common-because-its-easy Return on Ad Spend or ROAS model.
Drew Sanocki gives a cogent critique of ROAS and suggests an alternative: ROMI. He writes
A “return” on an investment means profits or cash generated. It doesn’t mean revenue generated. If we are doing productive marketing, we are after profits. We need to know the investment return on our spend. Revenue doesn’t pay the bills; profits do.
Drew’s mentor Jim Novo inspired the Return on Marketing Investment framing, which, in a nutshell, is this:
ROMI = Amount You Made / Amount You Paid to get it
The amount you made is sales – variable operating costs – marketing expenses.
The amount you paid is marketing expenses + discounts.
This approach is fundamentally more informative to your steering of the ship, so to speak, then an agency’s hitting a 10X ROAS target.
In the example of the cheese company in Sanocki’s article, he shows the owner makes back a 114% ROMI, which means he spent $1 on marketing, got back $1, and then kept an additional $1.14 as profit for that month.
Is my marketing spend more productive?
Annualized, that 114% nears 1300%. Sounds great!
So then you might be wondering about ROMI definitions and accounting details in your business. And that’s where it gets murky and feels like it might be a lot of numbers work.
(Hey, we’ve got a workshop for that!)
But give ROMI a closer look. If you make it through the process of budgeting, measuring variable costs, tracking your discounts, etc., then you’ll become truly confident in answering the question:
Is my marketing spend more productive this year than last year?
I like this model on an annualized view, taking in the big picture and making budgets for the quarters leading up to a peak season. But you can get more granular if you’re in a phase of marketing refinement or experimentation…
Attribution of results by campaign informs experiments
If you select an attribution model (last touch, first touch, etc.) and stick with it, you can start to evaluate campaigns, comparing one to another and measuring their relative productivity at yielding profit.
(For Klaviyo users sending both emails and SMS, check this explanation of their correction of revenue attribution.)
You might compare one email campaign to another, but a more meaningful comparison might be evaluating an email campaign to a printed postcard campaign.
Or compare all email campaigns in a month to all postcard campaigns in a month.
Or compare no postcard campaigns to two postcard campaigns in a given period!
This leads you to be able to make a decision of which channels / mediums are worth more spend in your next budget.
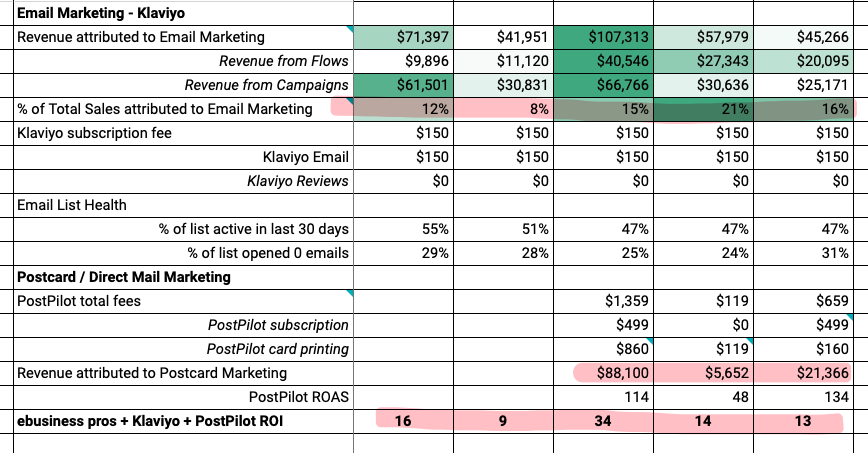
Let’s take a step back and look at an example of a client’s results in an expedient, non-ROMI format. They’re on a $4,300 mo plan for our agency. We track “ROI” in a shared, hosted spreadsheet:

Example of the postal mailing channel
You’ll see in this example there is a measure of total sales attributed to the email channel. The bottom row is like a ROAS number (but it’s not “ads” in a pay-per-click context).
Klaviyo’s attribution model ties revenue to order activity in Shopify within a window of time of the email or SMS send.
Note also that in the third month, another revenue line item appears: postcard direct mail through PostPilot.
Both Klaviyo and PostPilot integrate with Shopify. So what Klaviy flows can do with email or SMS automations, PostPilot can do with a personalized, segmented, delivery in the physical mailbox. Similarly, it can send ‘Win back’ campaigns. Woo hoo!
That’s what you’re seeing in the third month on the spreadsheet. An $88k revenue-generating winback postcard campaign.
(See their longer window of attribution FAQ, because people apparently keep postcards laying around for 17 days!)
Measure outcomes beyond revenue
This spreadsheet’s insight about results seems useful, and it is! But remember that the revenue attribution models of Klaviyo and PostPilot are not mutually exclusive. So some revenue is double-counted based on delivery timing of the messages / offers.
(Pro tip: use a PostPilot specific coupon code to tie back definitively to the channel.)
There’s more to our spreadsheet than what we have room to show in this email. We measure outcomes beyond revenue. And we do consider this double-counting likelihood for revenue and make decisions with our eyes wide open.
But while it’s useful in the interim, a bigger picture view gained by a diligent Return on Marketing Investment (ROMI) analysis is what we recommend.

Revenue attribution that exceeds 100%!
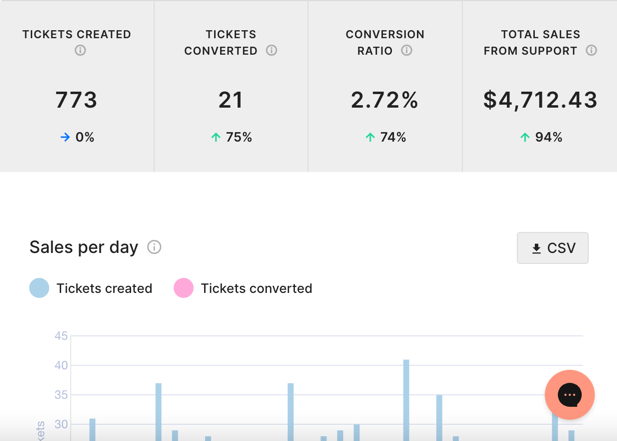
The chart above is taken from Gorgias, the popular customer service app that made a name for itself with deep Shopify integration and automations.
- We see direct and obvious savings in labor for our clients who implement Gorgias.
- We see improvements in conversion rate when all the CX metrics get better after Gorgias is running.
- But notice in this chart the claim of increased revenue, i.e. sales from support.
Take these numbers with a grain of salt. They are additive beyond 100% of your total revenue!
You could have $100k in revenue this week and see 30% of it claimed by Klaviyo, 40% claimed by Google Ads, 30% claimed by PostPitot, and already be at 110% of actual revenue before Gorgias claims credit for $4712.43
Gorgias is not wrong. But their revenue report can cloud your revenue attribution model, as can each additional app.
How then do you get clarity on your marketing spend decision-making?
Here’s an idea:

Ecommerce CFO Series: Budget for Q4 Profit
Join us in Austin on June 20 to learn how to gain confidence in your budgeting for Q3 and Q4 marketing. Understand what to change about your record-keeping and chart of accounts to get a better ROMI number.
I tapped Ecom CFO‘s founder Sam Hill to dive into this topic in a finance workshop format. Abigail will make sure it’s a wonderful event experience, a production of Frankly eCommerce!
Register here with code PROS50 to save 50% off the ticket price.
It’s live and in person, lunch included, so sorry to our wide-ranging newsletter readers who are not able to join us. If you’re interested in an online format of this material, please reply and let us know.
Quick Links
- A deep dive on Starbuck’s digital dilemma. What are simpler parallels in your business?
- A meditation on what’s real versus what we perceive: color as viewed by spiders!
- How does ChatGPT think? A psych / neuro attempt at an explanation.
